
Server Benchmark
Ephesoft provides a benchmark batch class (BC) and a sample set of documents for simple benchmarks. You can download the benchmark batch class and sample data from the Ephesoft wiki:
https://wiki.ephesoft.com/windows-performance
When importing the benchmark BC, be sure to edit the Export Multipage File plugin output folder to a valid path for your server.
The benchmark BC is very helpful for getting a baseline on how your Ephesoft server is running. For example, if your server is particularly slow, it may indicate a configuration issue (e.g., disk or JVM memory). The benchmark BC is very streamlined and your custom batch classes will typically be slower than this.
Performance Testing Dataset
For benchmarking your own batch classes, put together a representative document data set. This should match as closely as possible the type and size of documents you expect to see in production. For example, if you expect documents with a small number of pages, then use similarly sized documents for testing. If you expect 1,000-page documents, then test with large documents. If your input documents will vary in size then use a variety of sizes. In general, try to use test batches with a large number of pages (at least 1,000) to give the server a better workout and provide more accurate statistics. There will be a difference between processing one 1,000-page document and 1,000 one-page documents. Using the same incoming document type will also give more realistic results so use TIFF or PDF files (or a mix of both) based on your production scenario.
Create a New Performance Batch Class?
Most batches classes will be configured to stop in the review and/or validation step. So, when running your performance test dataset, the batch instances (BIs) will stop at the review and/or validation workflow step. This means the data will only test the performance of the modules up to that point. Given that the page processing module (which runs before the review module) is often the slowest, this may be fine. However, if you need a true end-to-end test (to include extraction and export), you may want to create a special BC. The BC should be a copy of the BC you are trying to test but with document and field confidence thresholds and/or scripts modified so the batches will not stop during processing. Obviously, don’t modify the BC too much or the test won’t give meaningful results! This means you can then process your sample batches and get accurate end-to-end data without any of the manual steps interfering with the results.
Test, Test, Test
Once you have your own benchmark batch classes and the dataset ready you can run some tests. Rather than using the upload tool, which may add additional processing time, when testing directly drop the samples into the appropriate input folders. This will also let you place the dataset files into folders which will become separate batch instances during import. Run tests at least three times to get an overall average. If you see a lot of variability in run times, more test runs may be necessary. Use the reporting tool to get the breakdown by module, and keep notes of the performance results so you can compare this data with the later runs.
To get the overall time for a batch instance to execute run a DB query to look at the batch instance start and update times in the batch_instance database table.
from batch_instance
where batch_class_id=17
and batch_status like ‘READY_FOR_VALIDATION’
This query will give the run time durations for all batch instances (BIs) for the batch class id (BC) 17 in the state READY_FOR_VALIDATION.
An Ephesoft workflow consists of modules, and each module can have several plugins. Therefore, performance testing commonly involves profiling at both the module and plugin level.
The easiest way to measure module performance is to use the built-in Ephesoft reports. These will give page per minute (PPM) data for each BC and then break that down by module.
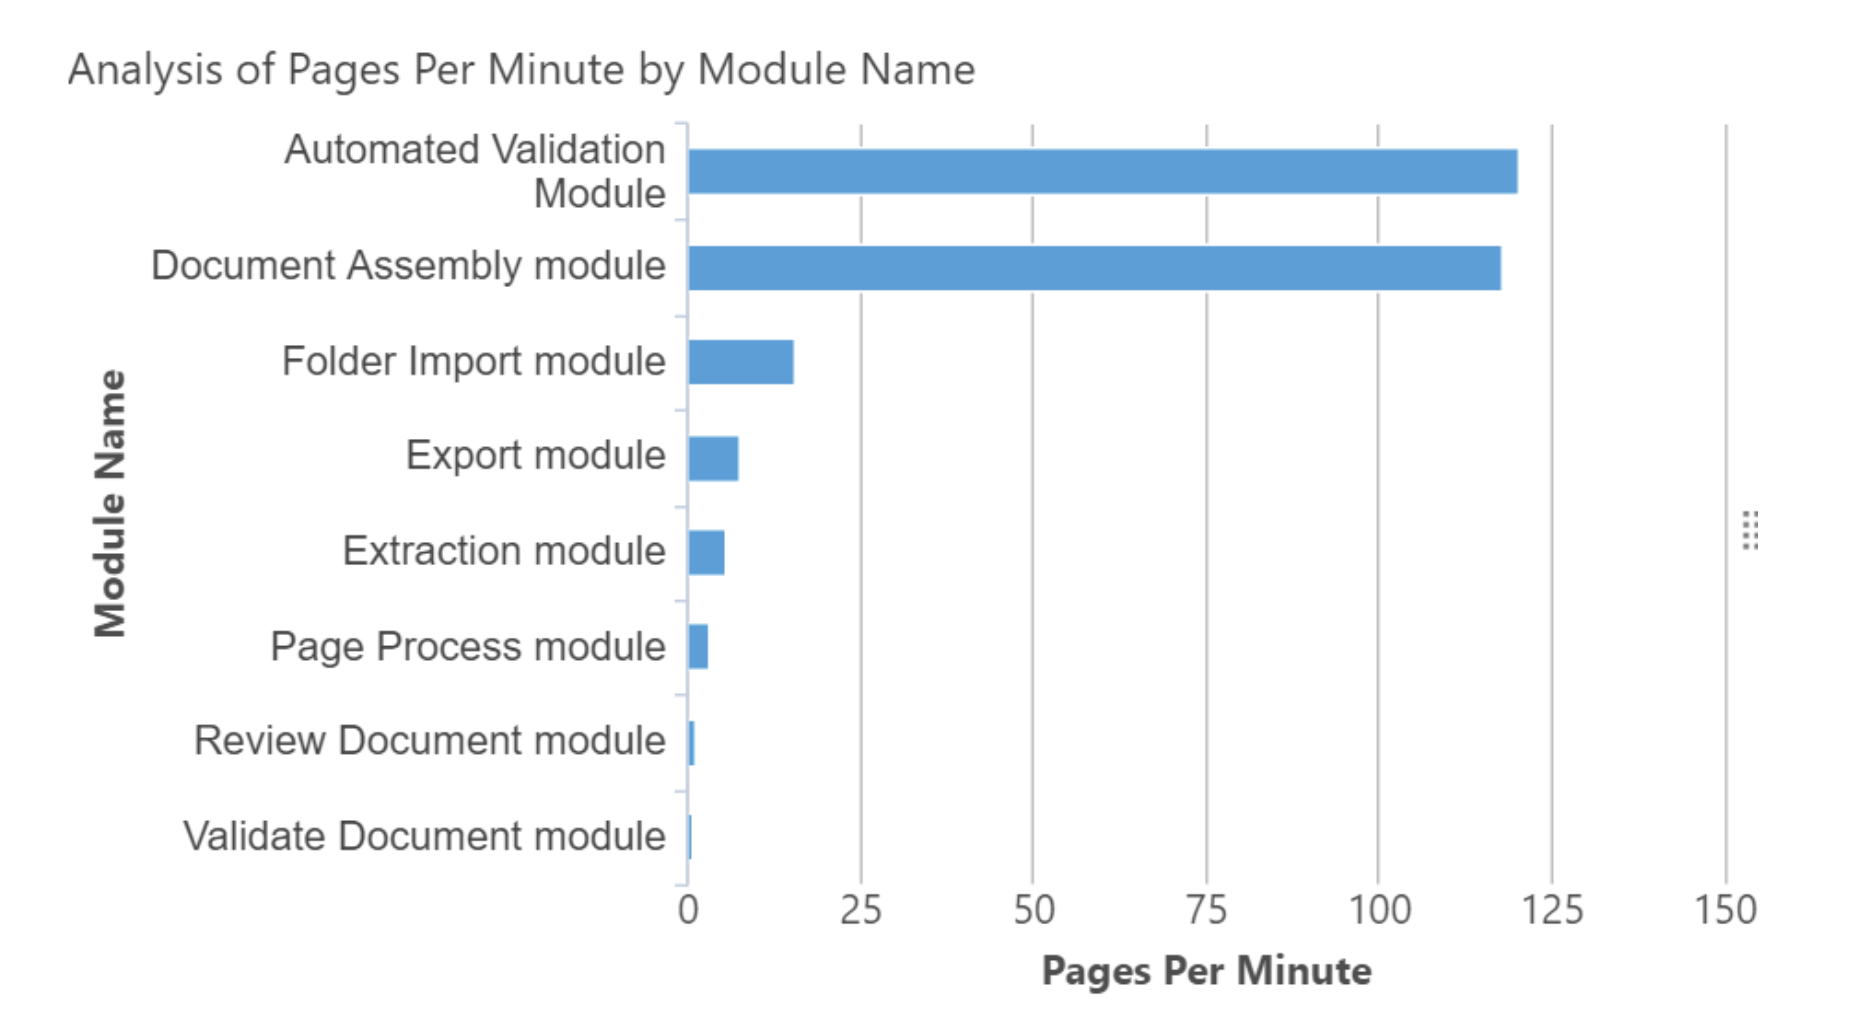
The higher the PPM values, the faster the modules are running—low values indicate slow processing. The review document and validate document data can be ignored as these are steps that rely on manual input for this sample BC.
To get profiling data on plugins, the query below (written for MySQL/MariaDB; SQLServer or Oracle will require SQL dialect modifications) will give the average plugin execution duration in ms for all BIs for a given BC.
select substring_index(substring_index(A.BUSINESS_KEY_,’.’,-1),’-‘,1) as plugin,
avg(A.DURATION_) as avg_duration
from REPORT_ARCHIVE.ACT_HI_PROCINST_COPY as A, REPORT_ARCHIVE.batch_instance as B
where A.BUSINESS_KEY_ like “%.%-p”
and NOT A.BUSINESS_KEY_ like “%Review_Document%”
and NOT A.BUSINESS_KEY_ like “%Validate_Document%”
and A.NAME_ = B.identifier
and B.batch_class_id=@BC
group by plugin
order by avg_duration desc;
This query will provide sorted output showing the slowest plugins first (highest values indicate the slowest plugins):
plugin |
avg_duration |
| Image_Process_Create_Thumbnails_Plugin | 99885.1724 |
| Recostar_HOCR_Generation_Plugin | 41837.1724 |
| Image_Process_Create_Display_Image_Plugin | 24348.3621 |
| Import_MultiPage_Files_Plugin | 18537.8936 |
| Image_Process_Create_OCR_Input_Plugin | 11844.6842 |
| Export_Scripting_Plugin | 4315.0000 |
| Image_Process_CreateMultiPage_Files_Plugin | 3745.5161 |
| Search_Classification_Plugin | 2100.5357 |
| Regex_Doc_Fields_Extraction_Plugin | 777.3788 |
| Import_Batch_Folder_Plugin | 720.8936 |
| Extraction_Scripting_Plugin | 550.4474 |
| Document_Assembler_Scripting_Plugin | 540.5102 |
| CMIS_Export_Plugin | 118.0000 |
| Copy_Batch_XML_Files_Plugin | 108.4194 |
| Automated_Regex_Validation_Plugin | 90.7544 |
| Recostar_Doc_Fields_Extraction_Plugin | 63.5766 |
| Automated_Validation_Scripting_Plugin | 47.7281 |
| Advanced_Barcode_Classification_Plugin | 36.1154 |
| Advanced_Barcode_Extraction_Plugin | 24.9474 |
| Document_Assembler_Plugin | 21.2241 |
| Multidimensional_Classification_Plugin | 13.6346 |
| Regular_Regex_Doc_Fields_Extraction_Plugin | 12.2424 |
| Table_Doc_Fields_Extraction_Plugin | 9.5758 |
| Machine_Learning_Extraction_Plugin | 9.4737
|
| FuzzyDB_Doc_Fields_Extraction_Plugin | 8.9242 |
| Cross_Section_Extraction_Plugin | 7.9470 |
| CleanUp_Plugin | 7.6000 |
| Paragraph_Extraction_Plugin | 7.0833
|
- Once a BI has completed on a timed schedule, Ephesoft will move data from the regular schema (called “ephesoft” by default) to the report schema (called “report” by default). On a second schedule, the report data is moved to the report archive schema (called “report_archive” by default). This query assumes data has been moved to the report_archive schema.
- You can add additional “where” statements to the query to use start/finish time or BI IDs to further constrain the results.
- The plugins Review_Document and Validate_Document are filtered out of the results as these are manual steps so the timing does not reflect machine processing duration.
Using these results, take note of the slowest plugins as these should be the focus of any performance optimization.
Web Services
If you are using Ephesoft web services it is easy to write your own automated performance tests. If you do this, make sure to test both serial and parallel web service calls. Running calls in parallel will show when the server gets saturated with calls and help indicate when server scaling may be necessary based on your expected call volume.
Server Stress
During test execution keep an eye on the server CPU load and memory usage. Ideally, your test document data set will push the server close to capacity and give high CPU usage. If CPU load is low during your testing try adding more batch instances to your test dataset. Note that memory use should allow plenty of overhead and should not get too high. If you still aren’t seeing at least 80% CPU load you can increase the number of concurrent batches being processed. In the file <EphesoftInstallFolder>/Application/WEB-INF/classes/META-INF/dcma-workflows\dcma-workflows.properties change:
server.instance.max.process.capacity.mode=1
and then add 1 or 2 to the value for:
server.instance.max.process.capacity
This property controls the number of concurrent batches.
Note that you can also set:
server.instance.max.process.capacity.mode=0
This will let Ephesoft decide for itself what the number of concurrent batches should be. You can leave this as-is if you don’t what to have explicit control.
In the next article, we will address the steps for batch class optimization. For additional information, contact us today.